OpenLayersでバイナリベクトルタイルをstyle.jsonでスタイリング表示する
はじめに
OpenLayersは基本機能だけでバイナリベクトルタイルをソースとしたレイヤーを表示する事が出来ます。
でも基本機能ではMapbox Style形式のいわゆるstyle.jsonを読み込む事は出来ません。 ここで、ol-mapbox-styleなるモジュールを使用して、style.jsonを適用してみました(React + TypeScriptでやってみました)。
ol-mapbox-style
yarn add ol-mapbox-style
対象のバイナリベクトルタイル
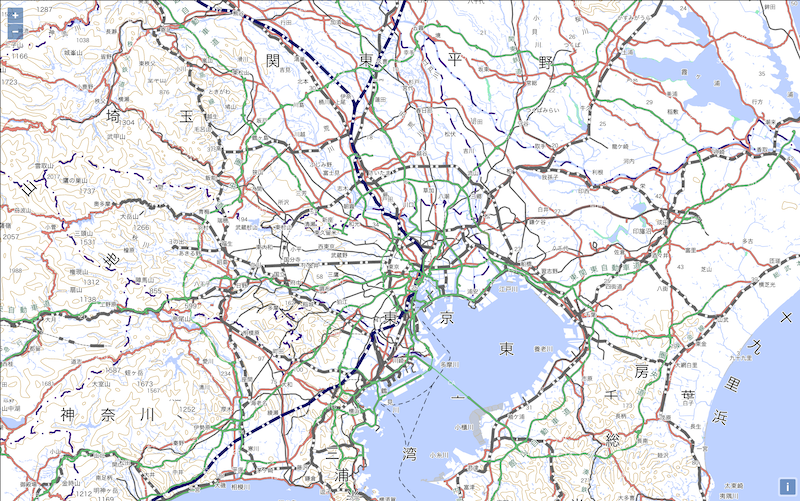
# 地理院ベクトルタイル
https://cyberjapandata.gsi.go.jp/xyz/experimental_bvmap/{z}/{x}/{y}.pbf
地理院ベクトルタイルのstyle.jsonは以下で取得出来ます。
実装例
React + TypeScript環境での実装例です。
型定義の適用
インストールするだけだと型定義が適用されずトランスパイラに怒られます。
上記に従い、tsconfig.jsonにいくつか追記します。
(includeとtypeAcquisitionを追記すればOK)
{
  "compilerOptions": {
    "target": "es5",
    "lib": [
      "dom",
      "dom.iterable",
      "esnext"
    ],
    "allowJs": true,
    "skipLibCheck": true,
    "esModuleInterop": true,
    "allowSyntheticDefaultImports": true,
    "strict": true,
    "forceConsistentCasingInFileNames": true,
    "noFallthroughCasesInSwitch": true,
    "module": "esnext",
    "moduleResolution": "node",
    "resolveJsonModule": true,
    "isolatedModules": true,
    "noEmit": true,
    "jsx": "react-jsx"
  },
  "include": [
    "src",
    "node_modules/ol-mapbox-style/**/*"
  ],
  "typeAcquisition": {
    "exclude": [
      "ol-mapbox-style"
    ]
  }
}
React Function Component + hooksでの実装例
import { useRef, useState, useEffect } from 'react';
import styled from 'styled-components';
import Map from 'ol/Map';
import View from 'ol/View';
import VectorTileLayer from 'ol/layer/VectorTile';
import VectorTileSource from 'ol/source/VectorTile';
import MVTFormat from 'ol/format/MVT';
import { fromLonLat } from 'ol/proj';
import 'ol/ol.css';

import style from './std.json';
import stylefunction from 'ol-mapbox-style/dist/stylefunction';

const MapPaneDiv = styled.div`
    width: 100%;
    height: 800px;
`;

const MapPane = () => {
    const [mapInstance, setMapInstance] = useState<Map>();
    const mapContainer = useRef<HTMLDivElement | null>(null);

    const vt = new VectorTileLayer({
        source: new VectorTileSource({
            format: new MVTFormat(),
            url:
                'https://cyberjapandata.gsi.go.jp/xyz/experimental_bvmap/{z}/{x}/{y}.pbf',
            attributions: [
                '<a href="https://github.com/gsi-cyberjapan/gsimaps-vector-experiment" target="_blank" rel=”noopener noreferrer”>国土地理院</a>',
            ],
        }),
    });

    // style.jsonで定義されているlayerのidを全て抽出
    const layers = style.layers.map((layer) => layer.id);
    // stylefunction(対象のOpenLayersレイヤー, mapbox-style, 対象のmapbox-layerのidの配列)でスタイル適用
    stylefunction(vt, style, layers);

    useEffect(() => {
        if (!mapInstance) {
            if (!mapContainer.current) {
                return;
            }
            const map = new Map({
                target: mapContainer.current,
                view: new View({
                    center: fromLonLat([140.46, 36.37]),
                    zoom: 10,
                }),
                layers: [vt],
            });
            setMapInstance(map);
        }
    }, [mapInstance]);
    return <MapPaneDiv ref={mapContainer}></MapPaneDiv>;
};

export default MapPane;

終わりに
OpenLayers自体が標準でベクトルタイル対応している事もあり、OSSの外部モジュールを使用するとは言え実装は簡単です。しかし非WebGLゆえの限界か、地物数が多くなると動作はかなりモッサリです。やはりMapbox GL JSは偉大だったんだなと。個人的にはharp.glに注目している訳ですが、まだまだMapbox GL JS依存からは抜けられそうにありません。現場からは以上です。